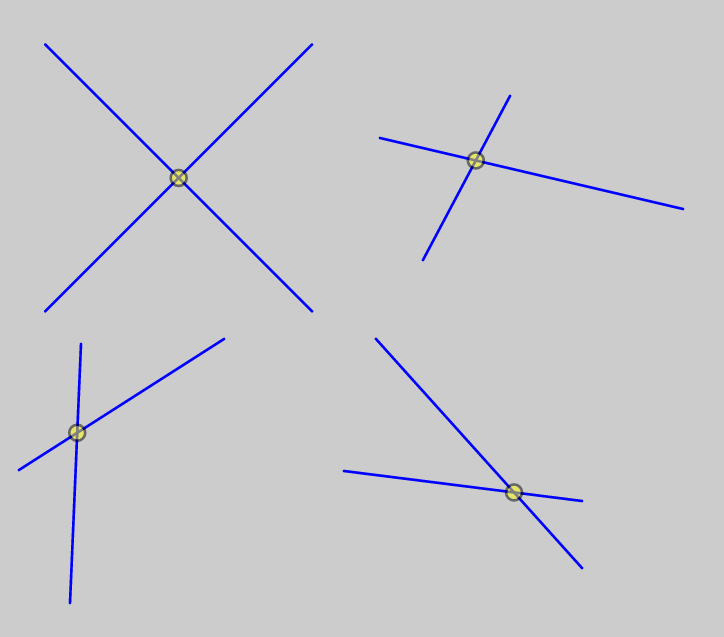
We tackle segment intersection. For every pair of consecutive segments the user draws, the intersection is computed on the server and displayed. The computation is asynchronous, and the client remains responsive until the result arrives.
1. Client
D3.js makes it possible to write brief, expressive code. It replaces jQuery. Also, visualization is a cornerstone, not an afterthought.
1.1. Geometry
Any system consisting partly of drawing requires handling coordinates. It is handy to formalize the notion of a point, which increases the readability of our code, eliminates a source of errors from handling independent coordinates, and encourages us to write geometric functionality just once, ultimately reducing the size of the system.
function Point(x, y) {
    this.x = x;
    this.y = y;
}
We do not aim here to design a full-fledged library, just the minimal functionality that keeps our code tidy. For example we have no need for transformations, and so we write no functions or classes for them.
For the segment class we make a distinction between the first and the second points entered by the user. We say that the segment is directed from its source to its target.
function Segment(src, tgt) {
    this.src = src;
    this.tgt = tgt;
}
An array stores the segments entered by the user, and a second array stores the computed intersection points. We seed the two arrays, to avoid wondering in this prototype starting from an empty image.
var segments = [
    new Segment(new Point( 20,  20), new Point(120, 120)),
    new Segment(new Point(120,  20), new Point( 20, 120))
];
var intersectionPoints = [
    new Point(70, 70)
];
1.2. D3.js
D3.js will handle rendering. After selecting the element that has an
id sketchpad (a div), we insert an SVG node.
function prelude() {
    var sketchpad = d3.select("#sketchpad");
    svg = sketchpad.append("svg")
                   .attr("viewBox", "0 0 300 300");
    return svg;
}
The refresh function is called once at the beginning, and every time
the user releases the mouse button to draw the second of a pair of
segments. We selectAll nodes of type line under the SVG node.
The chained functions from data to attrs handle the coupling
between our data structure (the array segments and its configuration)
and D3.js. data takes the two arrays (the array of SVG lines and the
array of segments) and splits the array of segments to two arrays, the
first matching in size the existing number of nodes, and the second
containing the excess. Internally D3.js terms these arrays _enter
and _exit. These correspond to the two functions enter() and
exit() that we can execute on their corresponding array.
In our case, and before the SVG diagram has been initialized, the
outcome of the selection will be an empty set. Hence the array
_enter prepared by D3.js will match the array segments passed as a
parameter. The array _exit will be emtpy. The next function,
enter(), iterates over each elements in _enter and appends an SVG
line for each element. SVG expects the attributes to be named x1,
y1, x2, and y2, and so those are the ones that we provide. Each
is initialized with an anonymous function that retrieves the
corresponding number in our structure (d.src.x, d.src.y, …).
The same operations are repeated. Only this time we insert small
circles (representing the intersection points) and match those
to the array points to draw the intersection points.
We skipped one detail: whenever possible, we’d like to minimize
creations/destructions on the DOM, to maximize responsiveness in the
interactive interface. We insert a segment with the id dragSegment
in the SVG diagram and only modify its opacity when it begins or ends
interaction. One detail in the selection remains. We did not write
svg.selectAll("line"). We wrote instead
svg.selectAll("line:not(#dragSegment)"). The former would have
selected all line nodes including dragSegment. The latter selects
all lines, but leaves out the one with the id dragSegment.
function refresh() {
    svg.selectAll("line:not(#dragSegment)")
       .data(segments)
       .enter()
       .append("line")
       .attrs({x1: function(d) { return d.src.x; },
               y1: function(d) { return d.src.y; },
               x2: function(d) { return d.tgt.x; },
               y2: function(d) { return d.tgt.y; }});

    svg.selectAll("circle")
       .data(intersectionPoints)
       .enter()
       .append("circle")
       .attrs({cx: function(d) { return d.x; },
               cy: function(d) { return d.y; },
               r: function(d) { return 3; }
       })
}
We maintain a boolean flag to signal whether the user is dragging a
segment, and also the initial point of the drag action, pointBegin.
var dragging = false;
var pointBegin = new Point(0, 0);
Next we define three functions to handle mousedown, mousemove, and
mouseup events. As mentioned, the dragSegment object remains part
of the SVG drawing. Only its opacity is updated during mouse press and
release events.
var mousedown = function() {
    dragging = true;
    pointBegin.x = d3.mouse(this)[0];
    pointBegin.y = d3.mouse(this)[1];
    fifiSeg.attrs({x1: pointBegin.x,
                   y1: pointBegin.y,
                   x2: pointBegin.x,
                   y2: pointBegin.y})
           .style("opacity", 1.0);
};
We leave some room for an optimization: We listen to mouse move events even when no drag operation is currently underway.
var mousemove = function() {
    if(dragging) {
        fifiSeg.attrs({x1: pointBegin.x,
                       y1: pointBegin.y,
                       x2: d3.mouse(this)[0],
                       y2: d3.mouse(this)[1]})
               .style("opacity", 1.0);
    }
};
D3.request takes the URL of the JSON request. After specifying in
the header that the request is a JSON message, we set the error and
load functions. The response string is parsed using JSON.parse(),
and if the two segments intersect, the point where they meet is
inserted in the array intersectionPoints. The post() function
prepares the message to send using JSON.stringify().
Neither the error nor the load functions are invoked directly. Both are callbacks, meaning that they are registered to respond to an error and to a load event. The computation proceeds uninterrupted after the message is posted. If the server is down, we only give a subtle hint to the user (by displaying a message in the console).
In particular, Now that calling refresh() has rendered the dragged
(either first or second) segment because a new segment has been pushed
to the array segments, we can immediately hide the fifi segment,
or the segment that provides the visual cue for rubber-banding, by
modifying its opacity.
var mouseup = function() {
    segments.push(new Segment(new Point(pointBegin.x, pointBegin.y),
                              new Point(d3.mouse(this)[0], d3.mouse(this)[1])));
    var sl = segments.length;
    if(sl % 2 == 0) {
        d3.request("calculate_intersection.php")
          .header("Content-Type", "application/json")
          .on("error", function(error) { console.log(error); })
          .on("load", function(xhr) {
              msg = JSON.parse(xhr.response);
              if(msg.intersection) {
                  intersectionPoints.push(new Point(msg.x, msg.y));
              }
              refresh();
          })
          .post(JSON.stringify({'seg1': segments[sl-2],
                                'seg2': segments[sl-1]}));
    }
    fifiSeg.style('opacity', 0.0);
    dragging = false;
    refresh();
};
The remainder of the code sets up the mouse event callbacks and
inserts an initially invisible fifiSeg in the SVG drawing.
function setup_callbacks(svg) {
    svg.on('mousedown', mousedown)
       .on('mousemove', mousemove)
       .on('mouseup', mouseup);
}

var svg = prelude();
var fifiSeg = svg.append("line")
                 .attr('id', 'dragSegment')
                 .attrs({x1: 0, y1: 0,
                         x2: 0, y2: 0})
                 .style('stroke', 'yellow')
                 .style("opacity", 0.0);

setup_callbacks(svg);
refresh();
2. Server
The Javascript code described above operates correctly regardless of whether the server is running. The only visual cue for the user is that the appearance of the intersection points.
2.1. PHP
The only routes that the client can access directly is the root
'/'. At that address we respond with the file index.html. The HTML
file consists of just a div placeholder where we will insert an
SVG node.
<!DOCTYPE html>
<head>
    <meta charset="UTF-8">
    <link rel="stylesheet" type="text/css" href="main.css">
</head>
<body>
    <h1>Sketchpad</h1>
    <div id="sketchpad">
    </div>
    <script src="https://d3js.org/d3.v4.min.js"></script>
    <script src="https://d3js.org/d3-selection-multi.v1.min.js"></script>

    <script>
        if (typeof d3 === 'undefined') {
            document.write('<script src="d3.min.js"><\/script>');
            document.write('<script src="d3v4sel.js"><\/script>');
        }
    </script>

    <script src="main.js"></script>
</body>
The API also consists of only one function at the URL
/calculate_intersection. Both the request ($data =
json_decode(..)) and the response (json_encode(..)) are JSON
strings. We construct two segments, compute their intersection, if
any, and respond with the point of intersection.
    $data = json_decode(file_get_contents('php://input'));

    include 'geom.php';

    $seg1 = new Segment($data->seg1);
    $seg2 = new Segment($data->seg2);
    $result = intersect($seg1, $seg2);

    header('Content-Type: application/json');
    echo json_encode($result);
2.2. Geometry
Here also we do not aim to build a comprehensive geometry library, but only those functions needed, starting with the humble determinant, the cornerstone of geometric calculations.
    function determinant($a, $b, $c, $d)
    {
        return $a * $d - $b * $c;
    }
A Point object can take either one or two arguments. If one, we
expect an instance of stdClass, as constructed by json_decode(..),
and if two, we expect the two coordinates.
    class Point {
        public $x, $y;
        public function __construct($x, $y) {
            $this->x = $x;
            $this->y = $y;
        }
        static public function stdCtr(stdClass $sc) {
            $newPoint = new self($sc->x, $sc->y);
            return $newPoint;
        }
    }
A Segment is also initialized by an instance of stdClass. A Line
is initialized by a segment.
    class Segment {
        public $src, $tgt;
        public function __construct(stdClass $sc) {
            $this->src = Point::stdCtr($sc->src);
            $this->tgt = Point::stdCtr($sc->tgt);
        }
    }

    class Line {
        public $a, $b, $c;
        public function __construct($seg) {
            $this->a = + determinant($seg->src->y,          1.0,
                                     $seg->tgt->y,          1.0);
            $this->b = - determinant($seg->src->x,          1.0,
                                     $seg->tgt->x,          1.0);
            $this->c = + determinant($seg->src->x, $seg->src->y,
                                     $seg->tgt->x, $seg->tgt->y);
        }
    }
To compute the intersection, we first determine whether the endpoints of each segment lie on opposite sides of the other.
    function oriented_side($line, $point) {
        return $line->a * $point->x + $line->b * $point->y + $line->c;
    }

    function straddle($line, $segment) {
        $src_side = oriented_side($line, $segment->src);
        $tgt_side = oriented_side($line, $segment->tgt);
        $s1 = ($src_side >= 0.0) && ($tgt_side <  0.0);
        $s2 = ($src_side <  0.0) && ($tgt_side >= 0.0);
        return $s1 || $s2;
    }
If both do, we find the intersection point.
    function intersect($seg1, $seg2) {
        $l1 = new Line($seg1);
        $l2 = new Line($seg2);
        if (straddle($l1, $seg2) && straddle($l2, $seg1)) {
            $denom = determinant($l1->a, $l1->b, $l2->a, $l2->b);
            if ($denom != 0.0) {
                $detx = + determinant($l1->b, $l1->c, $l2->b, $l2->c);
                $dety = - determinant($l1->a, $l1->c, $l2->a, $l2->c);
                return array("intersection" => true,
                             "x" => $detx/$denom,
                             "y" => $dety/$denom);
            }
        }
        return array("intersection" => false);
    }
The source code is here.
Back to CodingNirvana.ca